Image Details
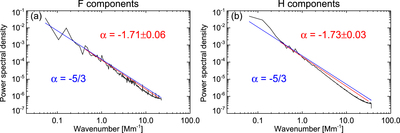
Caption: Figure 4.
Power spectral density of flux fluctuations (black curve). (a) The Fourier transform of the autocorrection function of fundamental flux at 30–40 MHz, see Figure 3(b). (b) The Fourier transform of the autocorrection function of the harmonic (H) component flux in Figure 3(d). The blue line is the Kolmogorov function of the ﹩P(k)\sim {k}^{-5/3}﹩ line. The red lines are obtained from least-square fitting of the power spectral density with the form ﹩P(k)\sim {k}^{-\alpha }﹩.
Other Images in This Article
Copyright and Terms & Conditions
© 2018. The American Astronomical Society.
Copyright ©
2026 Astronomy Image Explorer. All Rights Reserved.