Image Details
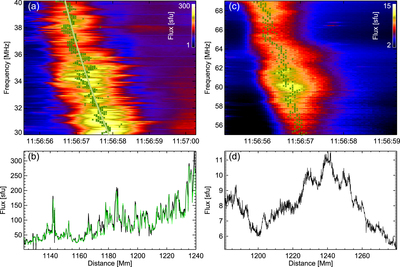
Caption: Figure 3.
(a) The spectrum of the fundamental (F) component at 30–40 MHz from 11:56:55 UT to 11:57:00 UT. The green asterisks show the positions of the fitted Gaussian peak times for the F component at each frequency. The green line represents the best fit through all the positions of the fitted Gaussian peaks using a least-square polynomial fitting function. (b) A plot of flux vs. distance using a Newkirk coronal density model (black solid line). The green line indicates the flux of the fitted Gaussian peak times for the F component at each frequency (green asterisks (a)). (c) The spectrum of the harmonic (H) component at 55–69 MHz. The green asterisks again show the fitted Gaussian peak times of the H components at each frequency. (d) Radio flux vs. distance as in (b), but for the H components.
Other Images in This Article
Copyright and Terms & Conditions
© 2018. The American Astronomical Society.