Image Details
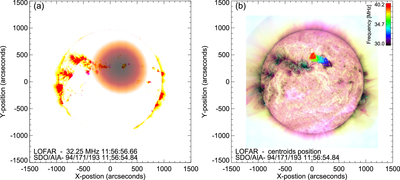
Caption: Figure 2.
(a) A composite of AIA images: 94 Å (red), 171 Å (green), and 193 Å (blue) highlighting the active regions (most of the red background). A 32.25 MHz LOFAR source at 11:56:56 UT is overlaid. (b) A composite image of AIA at the same time as (a), but using a different color table. The triangle symbols indicate the centroids of the fundamental LOFAR source at the frequencies and times corresponding to the green asterisks in Figure 3(a).
Other Images in This Article
Copyright and Terms & Conditions
© 2018. The American Astronomical Society.
Copyright ©
2026 Astronomy Image Explorer. All Rights Reserved.