Image Details
Caption: Figure 9.
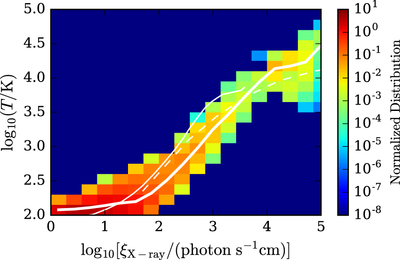
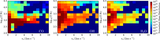
Distribution function of gas in the space spanned by ﹩\{{\mathrm{log}}_{10}T\}\times \{{\mathrm{log}}_{10}{\xi }_{{\rm{X}} \mbox{-} \mathrm{ray}}\}﹩, measured for the fiducial model. X-ray ionization parameter ﹩{\xi }_{{\rm{X}} \mbox{-} \mathrm{ray}}﹩ is defined as ﹩{F}_{X}/{n}_{{\rm{H}}}﹩, viz. photon number flux density divided by the number density of hydrogen nuclei. The heavy white curve indicates the ﹩{\mathrm{log}}_{10}\xi \mbox{--}\langle {\mathrm{log}}_{10}T\rangle ﹩ relation based on our colormap histogram (the average of ﹩{\mathrm{log}}_{10}T﹩ is weighted by the mass of gas), while the thin white curves indicate the hydrostatic ﹩\xi \mbox{--}T﹩ relations adopted in OECA10 (solid: inner-hole disks; dashed: primordial disks; note that the definition of ξ is different in OECA10, which is converted here to the definition in this paper).
Other Images in This Article
Copyright and Terms & Conditions
© 2017. The American Astronomical Society. All rights reserved.