Image Details
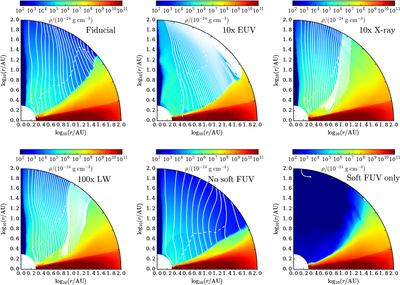
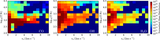
Caption: Figure 5.
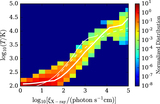
Selected plots of streamlines (based on a ﹩100\,\mathrm{year}﹩ average), overlaid on density colormaps, that are relevant to the discussions in Section 4. The white solid curves, showing the streamlines, are separated by ﹩{10}^{-10}\,{M}_{\odot }\,{\mathrm{yr}}^{-1}﹩ each. The white dashed curves denote the location of sonic point of all streamlines plotted. Note that, for clearer presentation, the radial coordinates in all panels are ﹩{\mathrm{log}}_{10}(r/\,\mathrm{au})﹩.
Other Images in This Article
Copyright and Terms & Conditions
© 2017. The American Astronomical Society. All rights reserved.
Copyright ©
2026 Astronomy Image Explorer. All Rights Reserved.