Image Details
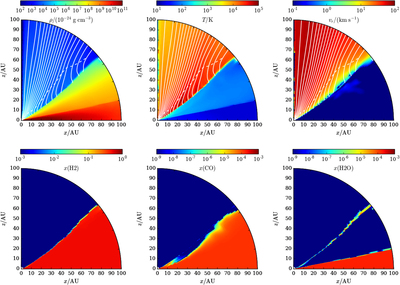
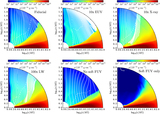
Caption: Figure 1.
Meridional plots for the fiducial model (Section 3), averaged through the final 100 years of the simulation. Top row: basic hydrodynamic profiles; left panel: mass density in units of ﹩{10}^{-24}\,{\rm{g}}\,{\mathrm{cm}}^{-3};﹩ middle panel: temperature in Kelvin; right panel: radial velocity in ﹩\mathrm{km}\ {{\rm{s}}}^{-1}﹩. Panels in the top row are overlapped by streamlines (white solid lines), separated by ﹩{10}^{-10}\,{M}_{\odot }\,{\mathrm{yr}}^{-1}﹩ wind mass-loss rate (see Section 4.1 for details), and the locations of sonic points (white dashed line). Bottom row: relative abundance of different species [in units of ﹩n({\rm{X}})/{n}_{{\rm{H}}}﹩]; left panel: ﹩{{\rm{H}}}_{2}﹩; middle panel: CO; right panel: H2O.
Other Images in This Article
Copyright and Terms & Conditions
© 2017. The American Astronomical Society. All rights reserved.