Image Details

Caption: Figure 16.
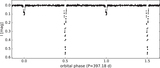
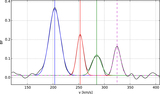
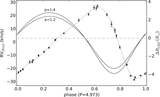
Ranges of fundamental mode period allowed by stellar pulsation calculations plotted vs. p-factor. At each p-factor, the minimum and maximum fundamental mode period in a set of models with different effective temperatures and different metallicities is plotted. The thick solid lines correspond to models within the instability strip, while the thin dashed lines correspond to models beyond the red edge. Model predictions are compared with the pulsation period observed for T2CEP-098 (thick and dotted horizontal line). The thin horizontal lines reflect the uncertainty inherent to pulsation modeling.
Other Images in This Article
Show More
Copyright and Terms & Conditions
© 2017. The American Astronomical Society. All rights reserved.
Copyright ©
2024 Astronomy Image Explorer. All Rights Reserved.