Image Details

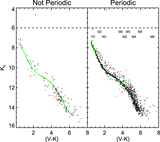
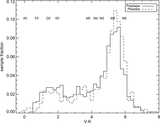
Caption: Figure 12.
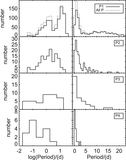
Distribution of ﹩(V-{K}_{{\rm{s}}})﹩ for the ensemble, with the single (red dotted line) and multiple (green dashed line) populations called out. The top panel is absolute numbers, and the bottom is the sample fraction. (The yellow dashed–dotted line is the sample fraction that is multi-periodic with the likely pulsators removed.) The transition between where multiple periods dominate is much bluer here (﹩(V-{K}_{{\rm{s}}})﹩ ∼ 1.5) than it was in the Pleiades (﹩(V-{K}_{{\rm{s}}})﹩ ∼ 2.6), and corresponds roughly to the point where the bluest “branch” turns down in the P vs. ﹩(V-{K}_{{\rm{s}}})﹩ diagram in Figure 6 above. The fraction of the rest of the sample that has multiple periods is roughly constant with color through the rest of the sample.
Other Images in This Article
Show More
Copyright and Terms & Conditions
© 2017. The American Astronomical Society. All rights reserved.