Image Details
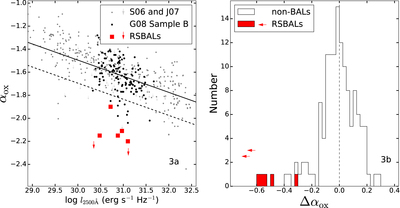
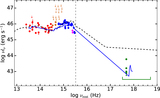
Caption: Figure 3.
Left panel: X-ray-to-optical power-law slope (﹩{\alpha }_{\mathrm{ox}}﹩) vs. monochromatic luminosity at rest-frame 2500 ﹩\mathring{\rm A} ﹩ (﹩{l}_{2500\mathring{\rm A} }﹩) for our RSBAL sample (red squares). The RSBAL sample of seven targets was observed by Chandra and two upper limits (represented by arrows) are shown for J0830+1654 and J1128+0113. Other samples in the figure are non-BALs from G08 sample B (improved following Wu et al. 2011), shown as black dots, and a combination of AGN samples from S06 and J07 is indicated by gray dots and downward arrows. The solid line represents the best-fit relation between ﹩{\alpha }_{\mathrm{ox}}﹩ and ﹩{l}_{2500\mathring{\rm A} }﹩ from Just et al. (2007); the dashed line (﹩{\rm{\Delta }}{\alpha }_{\mathrm{ox}}=-0.2﹩) separates X-ray normal and X-ray weak quasars. All seven of our targets are located in the X-ray weak region. Right panel: distribution of ﹩{\rm{\Delta }}{\alpha }_{\mathrm{ox}}﹩ for our RSBAL sample (shaded histograms) compared with the 132 non-BALs from G08 sample B. The two leftward red arrows are the upper limits of J0830+1654 and J1128+0113. The vertical dashed line indicates ﹩{\rm{\Delta }}{\alpha }_{\mathrm{ox}}=0﹩. All of our targets are in the X-ray-weak wing of the distribution, with six being significantly X-ray weaker than any of the G08 Sample B quasars.
Other Images in This Article
Copyright and Terms & Conditions
© 2017. The American Astronomical Society. All rights reserved.