Image Details
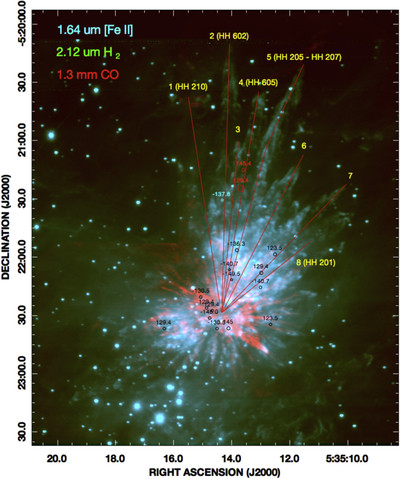
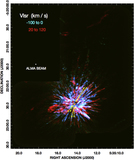
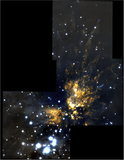
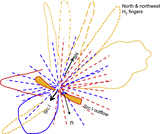
Caption: Figure 7.
Maximum brightness temperature CO maps in the redshifted and blueshifted radial velocity ranges shown in Figure 1 covering the high-velocity emission from −100 to +120 km s−1 (red) shown superimposed on the 2.12 μm fingers of shock-excited H2 emission (green) from the OMC1 outflow (Bally et al. 2011). The massive Trapezium stars responsible for ionization of the Orion Nebula appear near the bottom of this image. The eight most prominent H2 fingers are marked with red lines. The HH objects located at their ends are indicated. The small red and black circles indicate the locations and radial velocities of the highest velocity streamer ends listed in Table 1.
Other Images in This Article
Show More
Copyright and Terms & Conditions
© 2017. The American Astronomical Society. All rights reserved.