Image Details
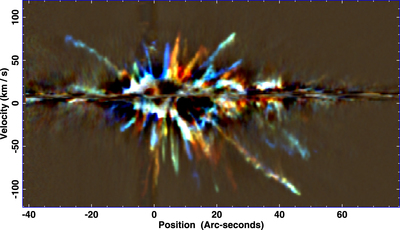
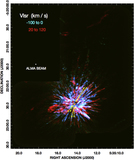
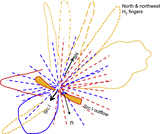
Caption: Figure 5.
North–south cuts across the OMC1 outflow at the R.A. of the explosion center showing the radial velocity structure over a 80″ (∼5 × 1017 cm or 0.16 pc) spatial region centered on the outflow in the 230 GHz CO J = 2−1 emission line. Three north–south strips (equivalent to “long-slit” spectra) separated by 0.″6 are shown in red, green, and blue. The green channel is centered at R.A. = 05h35m14.ˢ364. The red channel shows the “long-slit” spectrum 0.″6 to the east of this position; the blue channel shows the “long-slit” spectrum 0.″6 west of this position. The intensity scale ranges from −10 to 80 K. An animated version of Figure 5 showing the long-slit spectrum (upper panel) in which the slit orientation pivots 360° around the explosion center (lower panel) is provided in the online Journal. The animation is 15 s in duration.
(An animation of this figure is available.)
The video/animation of this figure is available in the online journal.
Other Images in This Article
Show More
Copyright and Terms & Conditions
© 2017. The American Astronomical Society. All rights reserved.