Image Details
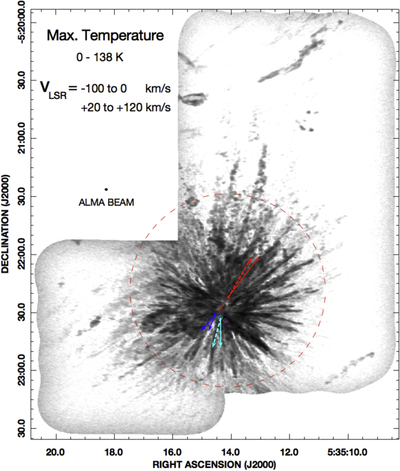
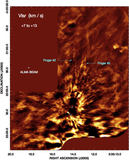
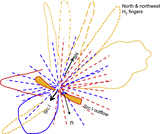
Caption: Figure 2.
ALMA CO image showing only the high-velocity emission, excluding the velocity range from VLSR = 0 to +20 km s−1. As in Figure 1, the maximum brightness temperature in the indicated velocity ranges is shown. However, in this figure, the logarithm of Tmax is shown to emphasize the low-level emission. A dashed circle with a radius of 50″ enclosing most of the high-velocity CO emission is shown for reference. The center of this circle is at J2000 = 05:35:14.11, −5: 22:18.7, about 10″ north–northwest of the ejection center. Proper motion vectors and luminous sources are shown as in Figure 1. Note the small outflows in the lower right and top of the figure. These are discussed in Section 3.6.
Other Images in This Article
Show More
Copyright and Terms & Conditions
© 2017. The American Astronomical Society. All rights reserved.