Image Details
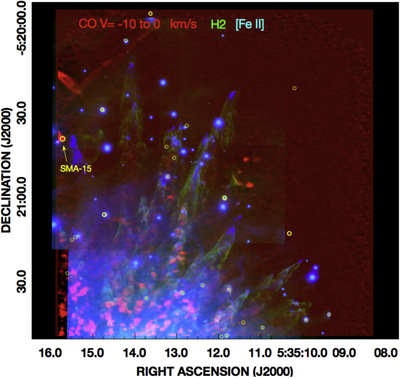
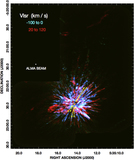
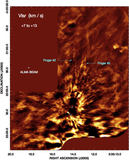
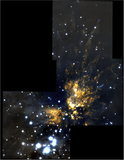
Caption: Figure 13.
Image showing the CO emission at VLSR = −10 to 0 km s−1 (red) superimposed on the H2 (green) and [Fe II] (blue) emission from Bally et al. (2015) in the region containing the north and northwest fingers.
Other Images in This Article
Show More
Copyright and Terms & Conditions
© 2017. The American Astronomical Society. All rights reserved.
Copyright ©
2026 Astronomy Image Explorer. All Rights Reserved.