Image Details

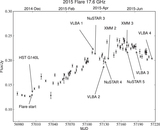
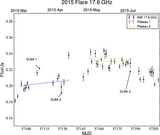
Caption: Figure 10.
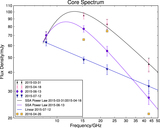
Beginning of the major radio flare that peaked in the spring of 2015. The top frame plots the total flux density from the AMI data. The spectral index has a large uncertainty. However, there is a consistent trend of spectral hardening that is evident more than a week before the 17.6 GHz flux density begins to increase and for 12 days afterwards. The bottom frame describes the implied change to the nuclear component using Equations (1)–(4) in the text. The spectrum hardens dramatically a few days days to two weeks before the G140L observation. The implication is that the flux was increasing at high frequency during this time period. As the disturbance propagates away from the nucleus, the SSA opacity decreases. Around the time of the G140L observations, the spectrum begins to soften and the 17.6 GHz flux density starts to increase rapidly, increasing by a factor of 4 in less than three weeks.
Other Images in This Article
Show More
Copyright and Terms & Conditions
© 2017. The American Astronomical Society. All rights reserved.