Image Details
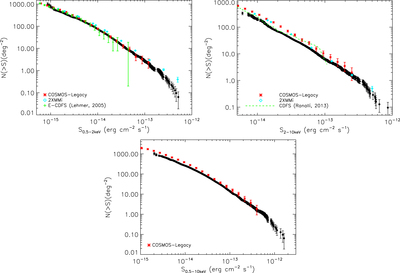
Caption: Figure 3.
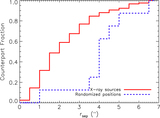
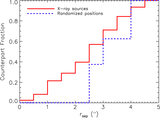
Cumulative Log N–Log S relationship for the Stripe 82X survey (black circles) in the soft (top left), hard (top right) , and full (bottom) bands. For reference, we also plot the source number density for other surveys, spanning the gamut from deep, pencil-beam surveys (i.e., the 0.3 deg2 ECDF-S and ∼0.25 deg2 CDFS; Lehmer et al. 2005; Ranalli et al. 2013, respectively), to a moderate-area, moderate depth survey (the 2.2 deg2 Chandra COSMOS-Legacy; Civano et al. 2015; Marchesi et al. 2015), and a wide-area survey (the 132 deg2 2XMMi Serendipitous Survey; Mateos et al. 2008).
Other Images in This Article
Show More
Copyright and Terms & Conditions
© 2016. The American Astronomical Society. All rights reserved.
Copyright ©
2024 Astronomy Image Explorer. All Rights Reserved.