Image Details
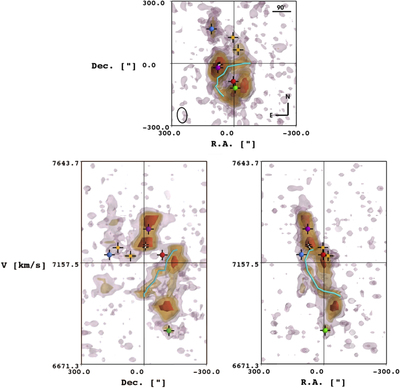
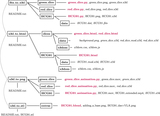
Caption: Figure 3.
H I gas distribution and kinematics of the compact group of galaxies HCG 91 observed by the VLA. Individual intensity iso-contours at 1.3, 2.5, 3.5, and 6.0 mJy/beam are fitted in 3D inside the datacube before being projected along top-front-side projections. The innermost contour is fully opaque, while the others are set at 80% transparency to enable a see-through effect. The galaxies HCG 91a, b, c, and d are marked with green, blue, purple, and red spheres, respectively. A large tidal tail originating to the southeast of HCG 91a is traced inside the 3D cube with a cyan line, and other elements of interest are marked with white and yellow cubes (see Vogt et al. 2015 for details). In the top panel, the black ellipse traces the beam size and orientation associated with the VLA data. An interactive version of this figure is accessible online as an interactive HTML document.
An interactive version of this figure is available in the online journal.
Other Images in This Article


Copyright and Terms & Conditions
© 2016. The American Astronomical Society. All rights reserved.