Image Details

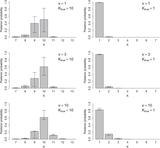
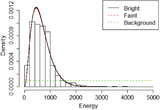
Caption: Figure 13.
Detailed spectral analysis of overlapping COUP sources #732 and #744. Best-fit values of absorption column ((a), (b)), temperature ((c), (d)), metallicity ((e), (f)), and flux ((g), (h)) for the disentangled analysis, for each of 1000 allocations of the photons are shown as histograms. Panels (a), (c), (e), and (g) correspond to the bright source and panels (b), (d), (f), and (h) correspond to the fainter source. The naïve analysis best-fit values and their 68% intervals are shown by the solid and dashed red vertical lines, respectively. The width of the histograms only account for uncertainty due to the allocation of photons, and not additional statistical error, which is well described by the intervals shown for the naïve analysis.
Other Images in This Article
Show More
Copyright and Terms & Conditions
© 2015. The American Astronomical Society. All rights reserved.