Image Details
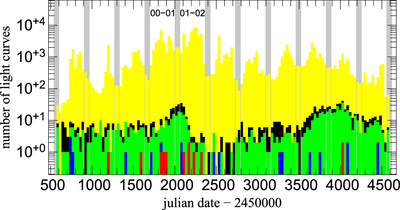
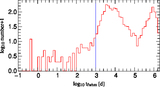
Caption: Figure 6.
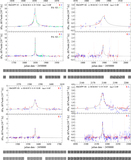
Histogram of the number of light curves passing different detection criteria. Our most complete seasons (2000/2001 and 2001/2002) are marked with “00–01” and “01–02.” Yellow: χ-limit (III). Black: S/N constraint and good PSF (IV) at light curve maximum. Green: energy criterion for the 20 closest data points to the maximum (V). Blue: timescale constraint (VI). Red: sampling criterion for the closest data points to the maximum (VII). In the end we are left with 12 microlensing events detected (see Table 2 for details). Eight of them took place during the two best observing seasons 2000/2001 and 2001/2002.
Other Images in This Article

Show More
Copyright and Terms & Conditions
© 2015. The American Astronomical Society. All rights reserved.