Image Details
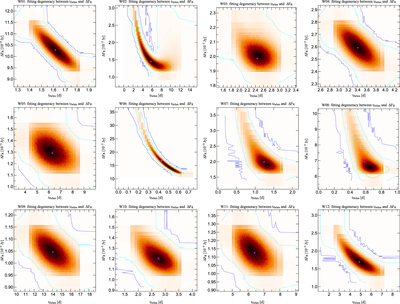
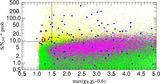
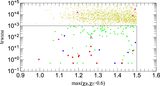
Caption: Figure 15.
﹩{t}_{\mathrm{FWHM}}﹩ vs. ﹩{{\rm{\Delta }}_{F}}_{\rm{R}}﹩ distribution of the 12 WeCAPP microlensing events. We note that the ﹩{t}_{\mathrm{FWHM}}﹩ and ﹩{{\rm{\Delta }}_{F}}_{\rm{R}}﹩ scales shown are different for each event. The 1σ, 2σ, and 3σ contours are marked in green, cyan, and blue, respectively. The best-fit parameter is marked in magenta.
Other Images in This Article

Show More
Copyright and Terms & Conditions
© 2015. The American Astronomical Society. All rights reserved.
Copyright ©
2026 Astronomy Image Explorer. All Rights Reserved.