Image Details
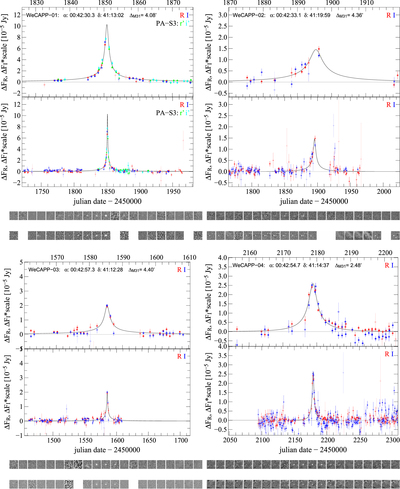
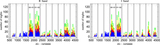
Caption: Figure 10.
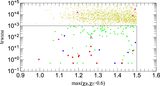
WeCAPP microlensing event light curves: WeCAPP 1–4 with corresponding cut-outs of the difference frames in R- and I-bands. The data points are color-coded in gray-scale according to their errors; measurements with larger errors in R (I) are shown in light red (light blue), while measurements with smaller errors are shown in dark red (dark blue).
Other Images in This Article

Show More
Copyright and Terms & Conditions
© 2015. The American Astronomical Society. All rights reserved.
Copyright ©
2026 Astronomy Image Explorer. All Rights Reserved.