Image Details
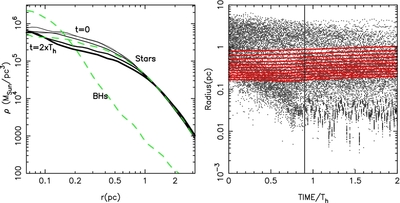
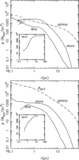
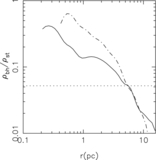
Caption: Figure 6.
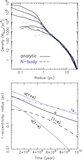
Evolution of the cluster model during the initial N-body integrations used to realize the mass-segregated cluster models for runs A1 and A2 (see Table 1). The left panel shows the evolution of the stellar density profile. The line thickness increases with time. The green dashed curves give the density profile of stars and BHs used as initial conditions for the inspiral runs. The right panel gives the Lagrangian radii of the stellar component (red solid curves) and the BHs distance from the cluster center (black dots). The BHs segregate to the cluster core, forming a dense sub-cluster in about one half-mass relaxation time as defined by the stellar component. The stellar cluster slightly expands because of heating by the inspiraling BHs. The vertical line gives the time at which we extracted the initial conditions for the inspiral simulations.
Other Images in This Article
Show More
Copyright and Terms & Conditions
© 2014. The American Astronomical Society. All rights reserved.