Image Details
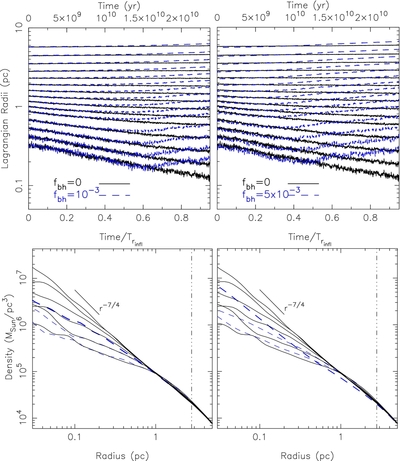
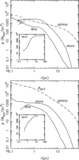
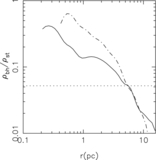
Caption: Figure 3.
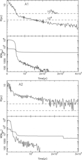
Evolution of the fbh = 0 model Lagrangian radii and density profile compared with the evolution of models with fbh = 10−3 (left panel) and fbh = 5 × 10⁻³ (right panel). In the bottom panels the density profile is plotted at t = (0, 5, 10, 15, 20, 25) Gyr of evolution. The blue dashed curves give the evolution of the stellar distribution Lagrangian radii in the models with BHs, and the bottom panels show the respective stellar density profiles at t = (0, 5, 10) Gyr. Over a time of order 10 Gyr, the evolution of the density profile of stars in the fbh = 10−3 model is not much affected by the presence of the BHs. In the model with fbh = 5 × 10⁻³ the evolution toward the steady state is faster, and after 10 Gyr the stars have formed a cusp. Vertical lines give the MBH influence radius.
Other Images in This Article
Show More
Copyright and Terms & Conditions
© 2014. The American Astronomical Society. All rights reserved.