Image Details
Caption: Figure 9.
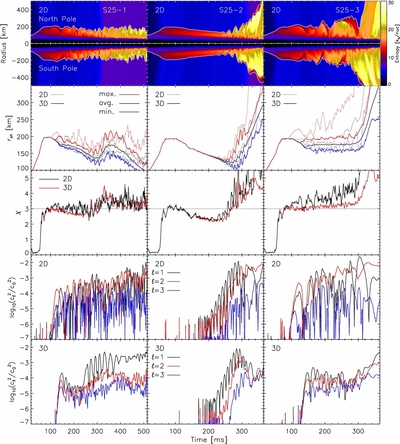
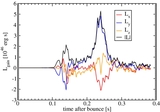
Comparison of the time evolution of 2D and 3D results of our set of parameterized postbounce simulations S25-1, S25-2, and
S25-3 of the 25
M
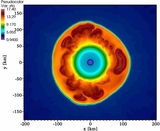
☉ progenitor. The upper panels show north polar and south polar entropy profiles for the 2D runs with thin white lines indicating
the shock trajectories, which separate low-entropy preshock matter (black and blue) from the high-entropy postshock region
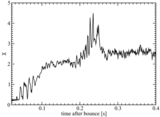
(red, orange, yellow). The second panels from the top display maximum, average, and minimum shock radii for 2D (dotted) and
3D models, the panels in the third line present the χ parameter for convective instability (Equation (7)) of 2D (black lines)
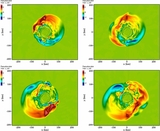
and 3D (red lines) cases, and the plots in the fourth and fifth lines provide the normalized pseudo-power coefficients
 (Equation (13)) on a logarithmic scale for the 2D and 3D simulations, respectively. Phases with values of χ ≲ 3 correlate
with preferred growth of low-mode (ℓ = 1, 2) SASI activity.
(Equation (13)) on a logarithmic scale for the 2D and 3D simulations, respectively. Phases with values of χ ≲ 3 correlate
with preferred growth of low-mode (ℓ = 1, 2) SASI activity.
Other Images in This Article
Copyright and Terms & Conditions
© 2013. The American Astronomical Society. All rights reserved.