Image Details
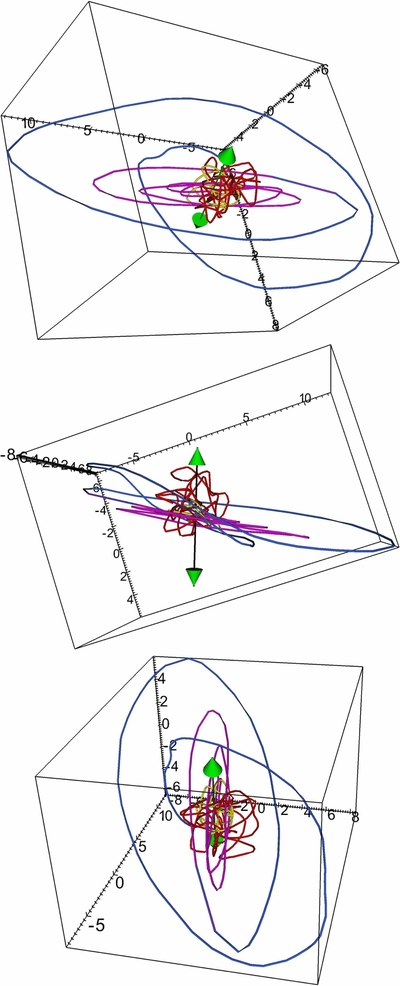
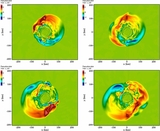
Caption: Figure 6.
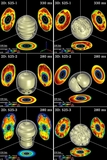
Evolution of the ℓ = 1 amplitude vector a 1 for the 27 M ☉ simulation from three different viewing angles. Different colors are used for the phase up to 177 ms (yellow), the phase of strong SASI sloshing activity (magenta, up to 225 ms), clearly developed SASI spiral motion (blue, up to 265 ms), and the late, SASI-quiet phase (red). The arrows indicate the vector n = (− 0.35, 0.93, 0.12) and its counter-vector perpendicular to the rotational plane of the SASI (see also Figure 7). Note that the transition from SASI sloshing to spiral behavior is gradual (and associated with a strong growth of the angular momentum in the gain layer; Figure 8), and the color coding is based on eye inspection rather than a precise definition.
Other Images in This Article
Copyright and Terms & Conditions
© 2013. The American Astronomical Society. All rights reserved.