Image Details
Caption: Figure 2.
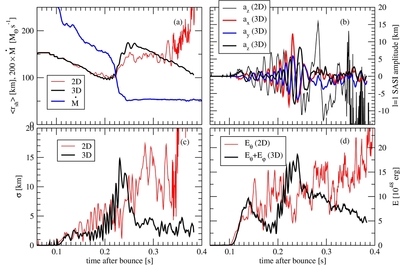
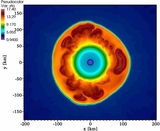
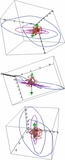
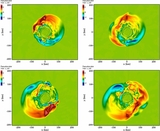
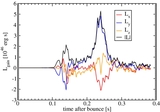
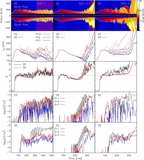
Comparison of SASI activity and shock evolution in the 2D and 3D simulations of the 27
M
☉ model. (a) Average shock radius (
![]() r
sh
r
sh
![]() =
a
0) and mass accretion rate of the collapsing stellar core at 400 km; (b) components of the SASI ℓ = 1 amplitude vector; (c)
rms shock deformation σ; and (d) kinetic energy of non-radial mass motions in the gain layer.
=
a
0) and mass accretion rate of the collapsing stellar core at 400 km; (b) components of the SASI ℓ = 1 amplitude vector; (c)
rms shock deformation σ; and (d) kinetic energy of non-radial mass motions in the gain layer.
Other Images in This Article
Copyright and Terms & Conditions
© 2013. The American Astronomical Society. All rights reserved.
Copyright ©
2026 Astronomy Image Explorer. All Rights Reserved.