Image Details
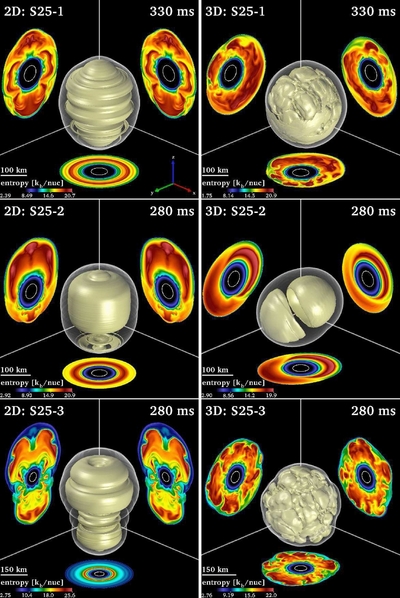
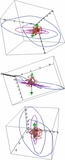
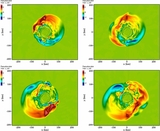
Caption: Figure 10.
Structure of the 2D (left) and 3D (right) models of our set of parameterized 25 M ☉ simulations (top: S25-1; middle: S25-2; bottom: S25-3) at representative postbounce times (as given in the upper right corner of each panel). The central object in all panels provides a three-dimensional visualization of the supernova shock (white, transparent surface), which engulfs a surface of constant entropy of 17 k b per nucleon. The images on the cube walls show entropy distributions (the color coding as given by the color bars in the lower left corners with black, blue, and green signaling low values) in the x- y, x- z, and y- z planes (orientation according to triad in the lower right corner of the upper left panel). The white circle indicates the inner grid boundary and a scale stick in each panel gives a measure of the size of the displayed volume. While the 3D model of S25-1 exhibits signatures of neutrino-driven convection and of low-order multipole asymmetry due to SASI shock sloshing, both the 2D and 3D cases of S25-2 show a clear dominance of SASI activity, whereas model S25-3 possesses the clearest pattern of neutrino-driven buoyancy.
Other Images in This Article
Copyright and Terms & Conditions
© 2013. The American Astronomical Society. All rights reserved.