Image Details
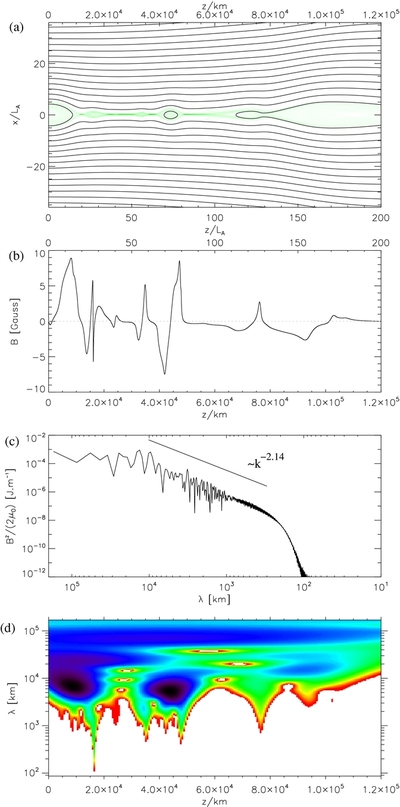
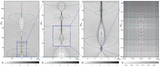
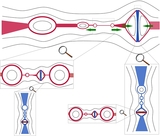
Caption: Figure 6.
One-dimensional scale analysis of magnetic field structure along the line x = 0. (a) Magnetic field lines and current-density structure (green) in the computational domain at t = 316. The z-axis shows positions both in units of L A (top) and in kilometers according to the scaling adopted in Section 2. (b) Profile of the B x component of magnetic field along the line x = 0. (c) Fourier power spectrum of the B x profile. (d) Wavelet power spectrum of the B x profile.
Other Images in This Article
Copyright and Terms & Conditions
© 2011. The American Astronomical Society. All rights reserved.
Copyright ©
2026 Astronomy Image Explorer. All Rights Reserved.