Image Details
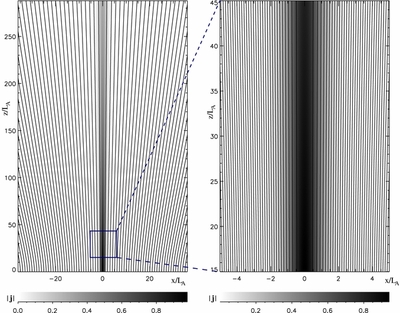
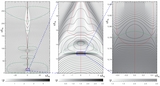
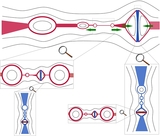
Caption: Figure 3.
Projection of the initial state ( t = 0) onto the xz-plane. Black lines represent the magnetic field lines; gray areas the magnitude of the current density: its scale is given underneath. Enhanced view of selected area (right panel) can be directly compared with the third panel in Figure 4.
Other Images in This Article
Copyright and Terms & Conditions
© 2011. The American Astronomical Society. All rights reserved.
Copyright ©
2026 Astronomy Image Explorer. All Rights Reserved.