Image Details
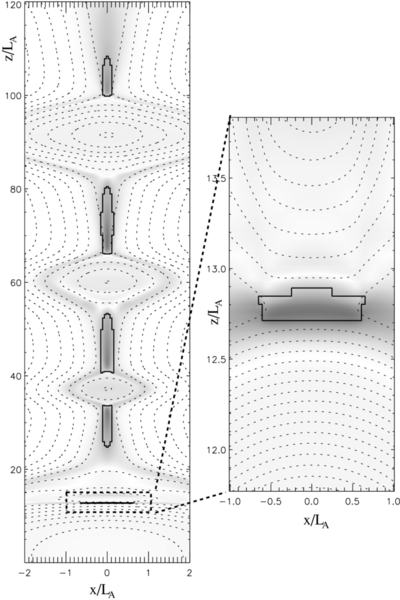
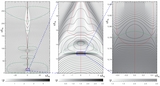
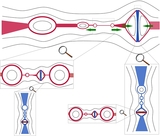
Caption: Figure 2.
Regions of adaptively enhanced resolution (thick-black-line-bounded areas) on the background of current-density magnitude (gray scale) and magnetic field lines (dashed). The right panel shows a zoomed view of the selected rectangle. Only the relevant subset of the whole computational domain is shown; note the strongly anisotropic axis scaling selected in order to show the high-resolution sub-domains better.
Other Images in This Article
Copyright and Terms & Conditions
© 2011. The American Astronomical Society. All rights reserved.
Copyright ©
2026 Astronomy Image Explorer. All Rights Reserved.