Image Details
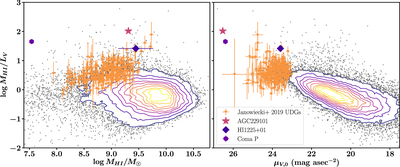
Caption: Figure 7.
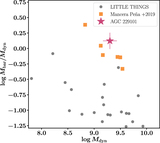
AGC 229101 compared with ALFALFA H I-bearing ultra-diffuse galaxies and other extreme sources, demonstrating the anomalous nature of AGC 229101 in this parameter space. The panels show the H I-mass—V-band luminosity ratio vs. H I-mass (left) and V-band peak surface brightness (right). Contours represent ALFALFA sources as measured with SDSS photometry (see, e.g., Haynes et al. 2011, 2018) increasing in 10% intervals, with outliers shown with small gray points. (Note: the most extreme outliers have poor optical photometry, as discussed in Section 4.1.) ALFALFA ultra-diffuse galaxies from Leisman et al. (2017) and Janowiecki et al. (2019) are shown with orange triangles, and the extreme ALFALFA sources Coma P and HI 1225 + 01, discussed in the text, are shown as a purple hexagon and blue diamond respectively. AGC 229101 is shown as a filled pink star, with a far lower surface brightness and higher gas fraction than almost all other ALFALFA galaxies. Note that the error bars on AGC 229101 are the size of or smaller than the marker.
Other Images in This Article
Copyright and Terms & Conditions
© 2021. The American Astronomical Society. All rights reserved.