Image Details
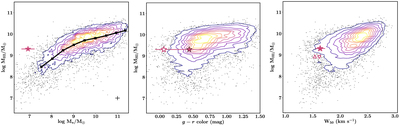
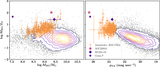
Caption: Figure 6.
AGC 229101 compared with ALFALFA galaxies from Huang et al. (2012). Contours represent ALFALFA sources as measured by Huang et al. (2012) in 10% intervals from 10% to 90%, with outliers shown by gray dots. Left: H I-mass—stellar mass relation for ALFALFA sources, with stellar masses derived from SED fitting best suited to nearby, gas-rich galaxies, as described in Huang et al. (2012). The median relation is shown in black, and typical uncertainties are shown by a black cross in the lower right corner. AGC 229101 is shown as a filled star symbol far off the relation. Note that the stellar mass for AGC 229101 plotted here is the stellar mass derived by matching to the Huang et al. (2012) masses, as discussed in Section 3.2.3. Further note that only including gas in the northern component of AGC 229101 reduces the H I mass by 0.3 dex, but still is extreme compared with extrapolation of the median ALFALFA sample. Center: H I-mass vs. g–r color for ALFALFA galaxies, compared with AGC 229101. The two measured colors (for two different apertures; see Section 3.2.2) are shown as filled and unfilled symbols and plotted with error bars, which overlap. Right: H I-mass vs. H I line width measured at the 50% flux level. The upward pointing triangle represents the northern H I peak, and the downward pointing triangle the southern H I peak. The line width for A229101—the entire source and the individual peaks—is very narrow relative to the ALFALFA sample.
Other Images in This Article
Copyright and Terms & Conditions
© 2021. The American Astronomical Society. All rights reserved.