Image Details
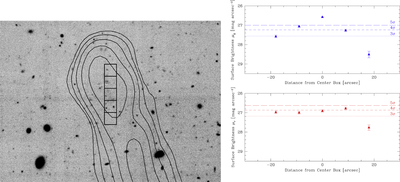
Caption: Figure 4.
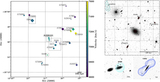
Surface brightness measurements of AGC 229101. The left panel shows a portion of the pODI image that includes the faint optical counterpart that coincides with the northern H I peak; H I contours are again overlaid as in Figure 1. The five square boxes used to calculate surface brightness values of the optical counterpart (see Section 3.2) are also shown. Two discrete sources that appear to be foreground objects (visible in the fourth box from the top) were masked out before the surface brightness measurements were made. The right panel shows the surface brightness values across the object in the g filter (top) and the r filter (bottom). The dotted and dashed lines show the 3σ, 4σ, and 5σ surface brightness detection thresholds in each filter.
Other Images in This Article
Copyright and Terms & Conditions
© 2021. The American Astronomical Society. All rights reserved.