Image Details
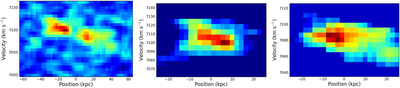
Caption: Figure 3.
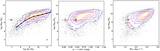
Position-velocity slices made along the major axis of the WSRT (lowest-resolution) data. Slices for each are 10″ wide. The left panel shows the position vs. velocity plot across the full extent of the source, the central panel shows just the northern portion of the source, and the right panel shows just the southern portion.
Other Images in This Article
Copyright and Terms & Conditions
© 2021. The American Astronomical Society. All rights reserved.
Copyright ©
2026 Astronomy Image Explorer. All Rights Reserved.