Image Details
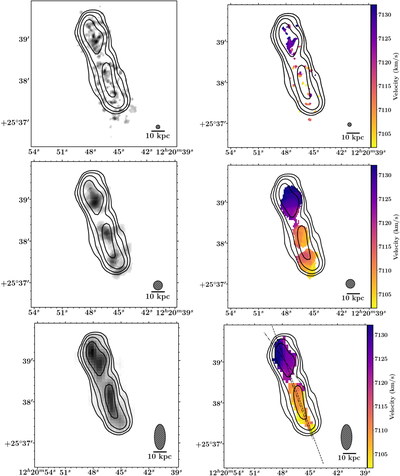
Caption: Figure 2.
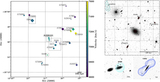
Left panels: H I moment zero column density maps at high (top: 5.″5 beam), mid (center: 13.″1 beam), and low resolutions (bottom: 16×37″ beam). The high- and mid-resolution maps are from combined VLA B-array and WSRT imaging, and the low-resolution map is from WSRT only, Briggs r = 0.4 imaging. Beam sizes are shown with hashed gray circles in the lower right on each plot. The column density scale in the top image is 0.5–4.5 × 10²⁰atoms cm−2, and is 0.15-3.2 × 10²⁰atoms cm−2 in the center image. Column density contours spaced in powers of 2 from 0.2–1.6 × 10²⁰atoms cm−2 from the WSRT moment 0 map are shown on all plots for direct comparison. Moment maps are masked to include only emission detected above 2σ, as discussed in the text. Right panels: Corresponding moment one velocity maps from combined VLA and WSRT (top and center), and WSRT only (bottom), imaging. Resolutions correspond to those of the moment zero maps to the left, masked at the 5σ level to highlight the motions of the highest signal-to-noise gas. The dashed line in the lower right panel shows the location of the position-velocity (PV) slice shown in Figure 3, and the dotted–dashed lines show the locations of the northern and southern PV slices in Figure 3.
Other Images in This Article
Copyright and Terms & Conditions
© 2021. The American Astronomical Society. All rights reserved.