Image Details
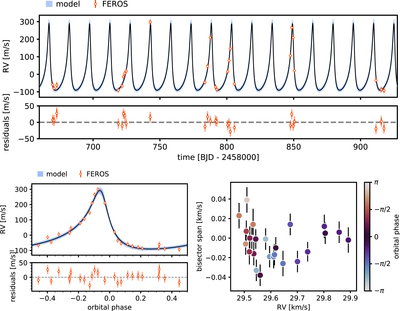
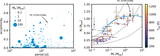
Caption: Figure 2.
RV time series for TIC 237913194. Light error bars reveal the best-fit jitter term, which we added in quadrature to the RV errors. The model generated with the derived parameters of our joint modeling is plotted with a black line, and blue bands denote its 68% and 95% posterior credibility intervals. Residuals are obtained by subtracting the median posterior model from the data. Top: RV time series measured with the FEROS spectrograph. Left: phase-folded RV measurements obtained with FEROS. Right: bisector span as a function of RV. The color of each measurement represents the orbital phase at which it was taken, assuming our best-fit period.
Other Images in This Article
Copyright and Terms & Conditions
© 2020. The American Astronomical Society. All rights reserved.