Image Details
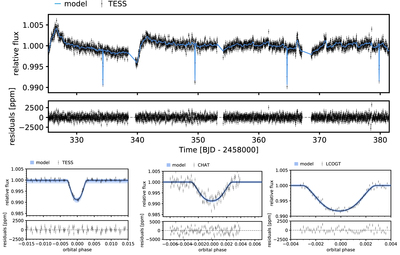
Caption: Figure 1.
Photometry for TIC 237913194. Gray points represent the relative flux and errors. Solid lines show the theoretical light curve using the best-fit parameters derived in the joint modeling including GP. Blue shaded regions denote the 68% and 95% credibility bands of the model. Residuals are shown below each light curve. Top: full TESS light curve generated from 30 minute cadence photometry of Sectors 1 and 2. Bottom left: phase-folded TESS photometry around the transit events. Bottom center: follow-up photometry of a single transit obtained with CHAT in the ﹩{i}^{{\prime} }﹩ band. Bottom right: LCOGT photometry of a single transit (i′ band). This additional transit photometry lifted the ﹩{R}_{{\rm{P}}}/{R}_{\star }-b﹩ degeneracy and strongly improved our constraint on the planet radius.
Other Images in This Article
Copyright and Terms & Conditions
© 2020. The American Astronomical Society. All rights reserved.