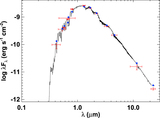
Image Details

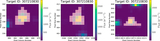
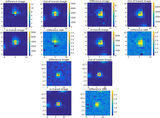
Caption: Figure 9.
DAVE centroid analysis of L 98-59 c for Sector 2 (four upper left panels), Sector 5 (upper right panels), and Sector 8 (lower panels). The four panels shown are in the same format as in the Data Validation Report, i.e., the mean difference image (upper left), mean out-of-transit image (upper right), mean in-transit image (lower left), and signal-to-noise ratio of the mean difference image (lower right). The red circles and cyan stars represent the measured individual photocenter for each transit. We measure no significant photocenter shift between the difference and out-of-transit images, consistent with the transit signals originating from the target itself.
Other Images in This Article

Show More
Copyright and Terms & Conditions
© 2019. The American Astronomical Society. All rights reserved.