Image Details

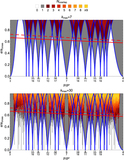
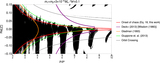
Caption: Figure 11.
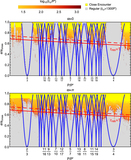
Comparison between onset of chaos and long-term evolution. The black/white background maps are reproduced from Figure 6. Red “x”s and colored squares show the outcome of long-term numerical simulations that lasted 107 orbits of the outer planet. Red “x”s denote integrations that were stopped early after experiencing a close encounter. The purple/green color scale indicates, for systems that did not experience close encounters, the maximum fractional deviation in the inner planet’s semimajor axis. In the top panel systems are initialized with ﹩{ \mathcal W }=0﹩ and in the bottom panel with ﹩{ \mathcal W }=0.1﹩. Orange curves indicate the Hill stability boundary from Gladman (1993). Our resonance overlap boundary (Equation (18)) is plotted in red.
Other Images in This Article
Show More
Copyright and Terms & Conditions
© 2018. The American Astronomical Society. All rights reserved.