Image Details
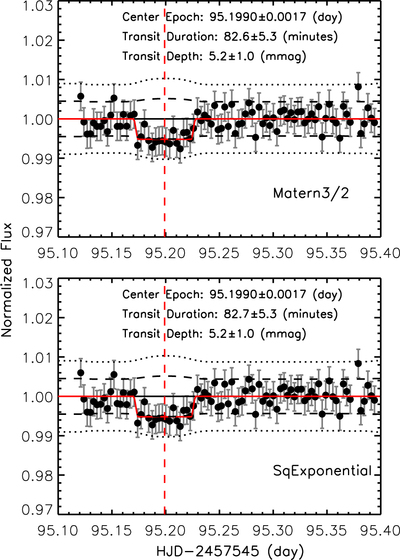
Caption: Figure 6.
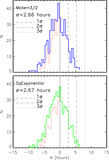
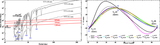
Nominal fit to the candidate transit event of Proxima Centauri b. The observed flux is normalized by the predicted flux from GP regression. The best-fitted transit model (red solid line) yields TC = 2,457,640.1990 ± 0.0017 HJD (the vertical red dashed line), Td = 82.6 ± 5.3 minutes, and D = 5.2 ± 1.0 mmag for GP regression using the Matérn 3/2 kernel, while TC = 2,457,640.1990 ± 0.0017 HJD, Td = 82.7 ± 5.3 minutes, and D = 5.2 ± 1.0 mmag for GP regression using the Squared Exponential kernel. The dashed lines and dotted lines are the 1σ and 2σ confidence regions of the GP regressions, respectively.
Other Images in This Article
Copyright and Terms & Conditions
© 2017. The American Astronomical Society. All rights reserved.
Copyright ©
2024 Astronomy Image Explorer. All Rights Reserved.