Image Details
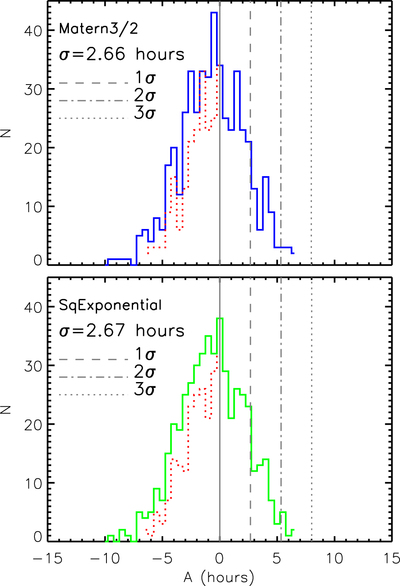
Caption: Figure 4.
Distribution of integrated depths A for all of the windows with a time length of 80 minutes. GP regressions using the Matérn 3/2 kernel (blue) and Squared Exponential kernel (green) give similar distributions. The integrated depths of A > 0 represent the depression of the observed flux compared to the GP predicted flux, while those with A < 0 represent the excess. The distribution is asymmetric, as the frequent stellar flaring of Proxima Centauri enhances the probability of flux excess. The integrated depths of A > 0 are mirrored (red dotted curve) to construct a nominal full distribution. Its standard deviation σ is reported as the fluctuation purely induced by time-correlated noise, yielding σM = 2.66 hr (Matérn 3/2 GP models) and σSE = 2.67 hr (Squared Exponential GP models) for the time length of 80 minutes.
Other Images in This Article
Copyright and Terms & Conditions
© 2017. The American Astronomical Society. All rights reserved.