Image Details

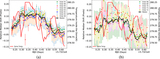
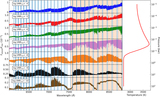
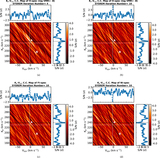
Caption: Figure 18.
Top panel: spectra from two different epochs for orders 93 (left panel), 92 (middle panel), and 91 (right panel), which were taken at the beginning (blue box) and the end (orange triangle) of the observation. The continuum profile of the second spectrum after correction (red circle) matched with the first spectrum. Bottom panel: ratio of the spectra before (blue circle) and after (black star) correction. The orange line is the smoothed ratio profile used to correct the variation.
Other Images in This Article
Show More
Copyright and Terms & Conditions
© 2017. The American Astronomical Society. All rights reserved.
Copyright ©
2024 Astronomy Image Explorer. All Rights Reserved.