Image Details

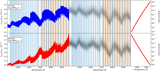
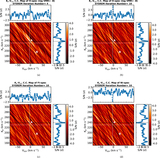
Caption: Figure 17.
Significance map after converting from the p-value from Welch’s t-test using the erf function for the most significant detected signal with the H-spec model spectrum of log VMRTiO = −8. The black dashes show the most significant signal, the white dashes show the expected Kp and Vsys, and the color bar grid interval is 1σ, and the white area also represents the 1σ error of the detected signal.
Other Images in This Article
Show More
Copyright and Terms & Conditions
© 2017. The American Astronomical Society. All rights reserved.
Copyright ©
2024 Astronomy Image Explorer. All Rights Reserved.