Image Details

Caption: Figure 14.
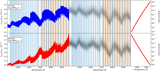
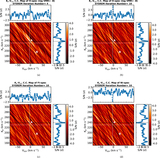
Kp–Vsys S/N map of H-spec with a maximum peak at Kp = +237.5 ﹩{}_{-5.0}^{+13.0}﹩ km s−1 and ﹩{V}_{\mathrm{sys}}=-{1.5}_{-10.5}^{+4.0}﹩ km s−1, which gives a 4.8σ detection. The white dashed line is the expected Kp and Vsys from previous studies. The top and right panels show the one-dimensional cross-section of the CCF peak along Vsys and Kp, respectively. The black dashed lines show the most significant signal, the white dashed lines show the expected Kp and Vsys, and the color bar grid interval is 1σ, and the white area also represents the 1σ error of the detected signal.
Other Images in This Article
Show More
Copyright and Terms & Conditions
© 2017. The American Astronomical Society. All rights reserved.
Copyright ©
2024 Astronomy Image Explorer. All Rights Reserved.