Image Details

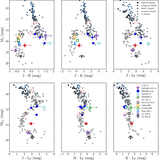
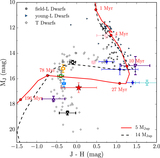
Caption: Figure 17.
Comparison of the planet spectrum and luminosity to a combination of initial entropy (﹩{k}_{{\rm{B}}}﹩/baryon) and planet mass (﹩{M}_{\mathrm{Jup}}﹩) from the warm-start evolutionary models of Spiegel & Burrows (2012). The four different atmospheres tested include cloud-free and hybrid cloud models, with both solar and supersolar metallicity. Also plotted are the 1σ (solid red), 2σ (dotted cyan), and 3σ (dashed yellow) contours. The entropy plotted in the figure and used in the modeling is not the entropy for the evolved object but rather the entropy at formation. The best-fitting model fit is indicated by the large circle (white and red circle). The orange filled circles show the hot-start model limits, while the blue filled circles show the cold-start limits, which are presented as the boundary cases in Spiegel & Burrows (2012). The top row compares the model luminosity to the inferred luminosity for 51 Eri b, and the bottom row compares directly the SED to the evolutionary model spectra.
Other Images in This Article
Show More
Copyright and Terms & Conditions
© 2017. The American Astronomical Society. All rights reserved.