Image Details

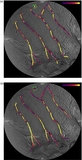
Caption: Figure 8.
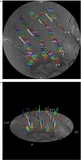
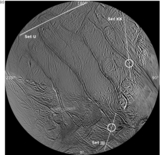
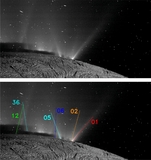
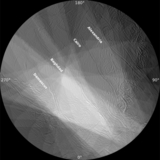
(a) ISS basemap of the SPT on which has been plotted the observed normalized jet activity, calculated and color-coded as described in the text. (b) A CIRS low-resolution map created from thermal emission data collected in 2008 and 2010 (Figure 3 of Howett et al. 2011), laid on the ISS basemap used in this work. From coldest to hottest, the color mapping is pale blue, deep blue, magenta, red, and dark yellow. Note the isolated hot spot at the top of Cairo Sulcus, which is coincident with a location of maximum shear stress, and through which passes a single jet groundtrack. (See the text and Figures 1(f) and 3(b).) (c) The map in Figure 6(a), showing the distribution of time-averaged shear stresses, smoothed with a 40 pixel (or ∼5 km) square sliding box. The same color scheme is used. (d) The map in Figure 6(b), showing the distribution of maximum normal stresses, smoothed with a 40 pixel (or ∼5 km) square sliding box. The same color scheme is used.
Other Images in This Article
Show More
Copyright and Terms & Conditions
© 2014. The American Astronomical Society. All rights reserved.
Copyright ©
2024 Astronomy Image Explorer. All Rights Reserved.