Image Details
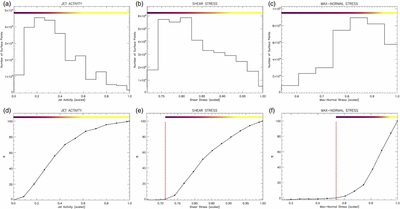
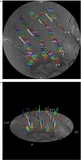
Caption: Figure 7.
Frequency histograms of the (a) scaled jet activity, (b) scaled time-averaged shear-stress, and (c) scaled maximum normal stress, and their respective cumulative histograms; i.e., the percentage of the total number of surface points that fall below a particular value of (d) jet activity, (e) shear stress, and (f) normal stress. The color-mapping scheme, determined from examination of the cumulative histograms and shown at the top of each histogram, was determined by assigning the top 15% of the distribution to yellow, and linearly scaling the "lower" colors to the lower stress or activity values, taking the lowest value to be either 0 in the jet activity distribution, or the indicated cutoff value in the stress histograms. These color assignments were used in our resulting maps.
Other Images in This Article
Show More
Copyright and Terms & Conditions
© 2014. The American Astronomical Society. All rights reserved.