Image Details
Caption: Figure 9.
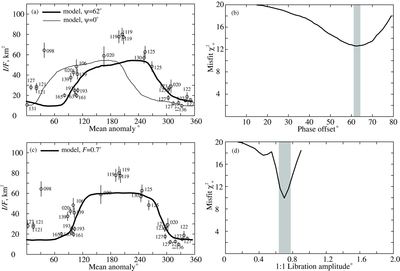
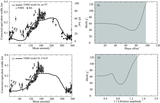
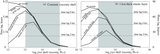
Comparison of observations and model predictions. Numbers indicate Cassini's orbit number (Table 1). The solid lines are based on the fraction of tiger stripes experiencing extensional normal stresses as discussed in Section 3. This fraction f is converted into a predicted I/F by linear scaling: I/F = a + (b − a)f. (a) Simple time-delay model fitted to the ISS data, where a = 7.5 km2 and b = 56 km2. The bold line is the minimum-misfit solution and includes a model phase lag ψ of 62°; the thin line is the same model but without a phase lag (ψ = 0). The thin and bold lines have misfits  of 20.6 and 12.6, respectively. (b) Misfit as a function of ψ, where for each ψ the best-fit values of a and b are also solved for. The shaded region gives the range of ψ at the 95% confidence level (Section 4). The actual phase lag is ~7° less than ψ because of the time-of-flight of jet particles. (c) As for panel (a), except the model shown is one in which an in-phase forced libration component with amplitude F of 0
![]() 7 is added to the ψ = 0 model and a = 12, b = 62 km2. The mean anomaly of each observation has been reduced by 7° to account for time-of-flight. (d) As for panel (b), but varying the libration amplitude. The minimum misfit is
7 is added to the ψ = 0 model and a = 12, b = 62 km2. The mean anomaly of each observation has been reduced by 7° to account for time-of-flight. (d) As for panel (b), but varying the libration amplitude. The minimum misfit is  = 9.94 and the range of F is 0
![]() 63–0
63–0![]() 77.
77.
Other Images in This Article
Copyright and Terms & Conditions
© 2014. The American Astronomical Society. All rights reserved.