Image Details
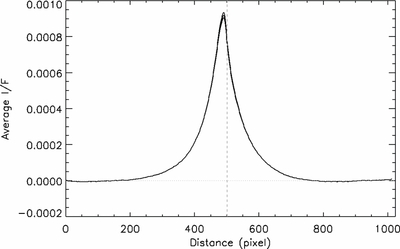
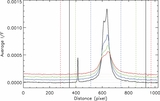
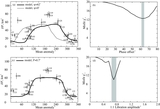
Caption: Figure 2.
Horizontal scan of vertically integrated (I/F)dy values, as described above, taken from Figure 1(b), and averaged. Three averaged scans are shown, each corresponding to a shift of 1 pixel in the position of the Enceladus limb, as a check on the navigation uncertainty. The horizontal dotted line shows the lower boundary on the region within which the values were summed to derive a final area-under-the-curve result.
Other Images in This Article
Copyright and Terms & Conditions
© 2014. The American Astronomical Society. All rights reserved.
Copyright ©
2024 Astronomy Image Explorer. All Rights Reserved.