Image Details
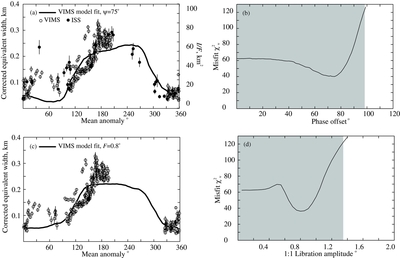
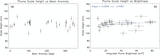
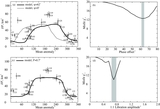
Caption: Figure 10.
Similar to Figure 9, except that there the VIMS observations of corrected equivalent width (CEW; Hedman et al. 2013) are used. (a) Best-fit model to VIMS-only data is shown with solid line. Here a = 0.015 km and b = 0.25 km (Equation (3)). Black dots are ISS data replotted from Figure 9 and assuming that CEW and I/F have a simple linear relationship. (b) Misfit as a function of phase lag. (c) As for panel (a), but the best-fit line shows the libration model fitted to VIMS-only with a = 0.045 km and b = 0.228 km. (d) Misfit as a function of libration amplitude.
Other Images in This Article
Copyright and Terms & Conditions
© 2014. The American Astronomical Society. All rights reserved.
Copyright ©
2024 Astronomy Image Explorer. All Rights Reserved.