Image Details
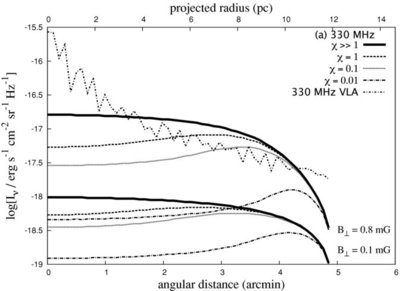
Caption: Figure 4.
Comparison of the actual emission intensity as a function of angular distance from the center of Sgr B2 and that expected from models of synchrotron emission from secondary electrons at 330 MHz. The curves are for the parameters labeled and match those of Figure 9 of Protheroe et al. (2008).
Other Images in This Article
Copyright and Terms & Conditions
© 2011. The American Astronomical Society. All rights reserved.
Copyright ©
2026 Astronomy Image Explorer. All Rights Reserved.